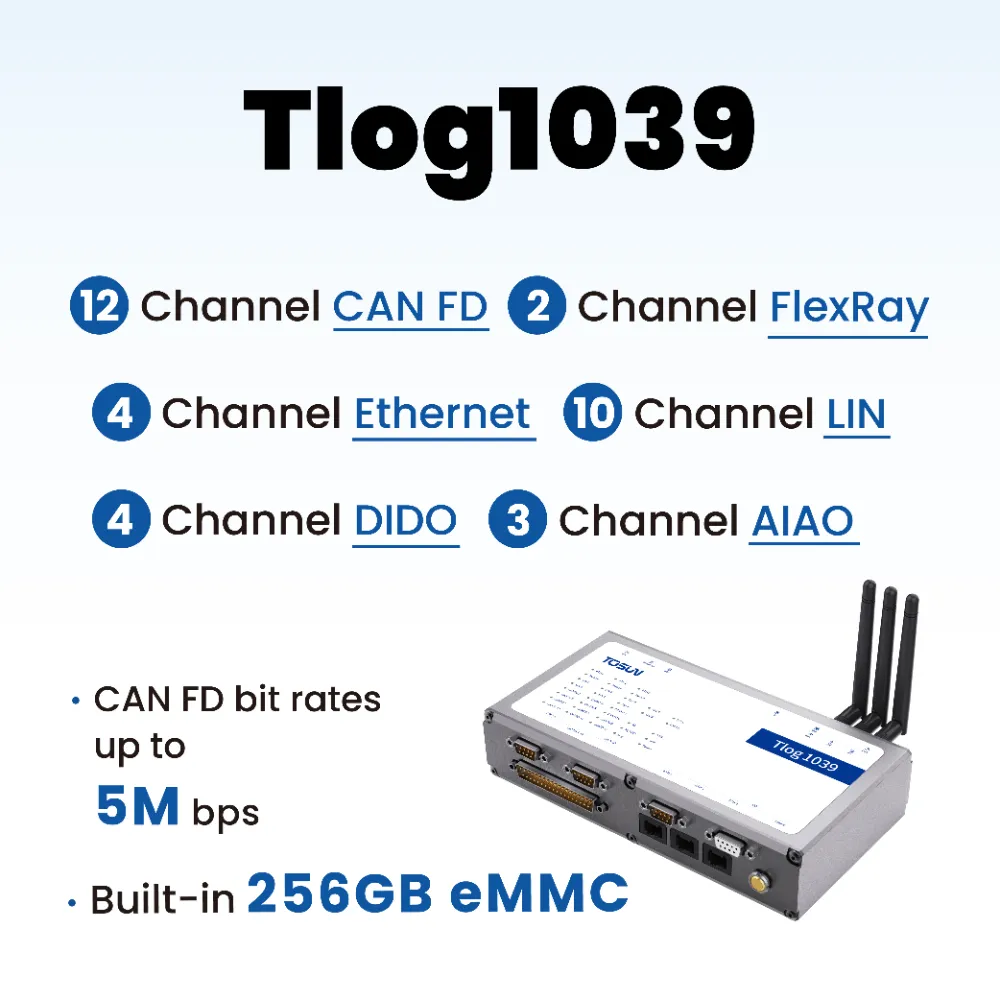
You are currently viewing 车载以太网 | TSMaster的DoIP功能操作指南

Vehicle Ethernet | DoIP Function Operation Guide for TSMaster

Vehicle Ethernet Diagnostic Protocol, Diagnostics over Internet Protocol abbreviated as DoIP, allows automotive diagnostics to be performed over the Ethernet protocol.DoIP is a standardized protocol used for communication and diagnostics between vehicles or between vehicles and diagnostic equipment. With DoIP, diagnostic engineers can access and diagnose a vehicle's electronic systems over Ethernet or remotely, and can perform diagnostic access and brushing of Ethernet controllers.

DoIP is one of the important functions supported by TSMaster, this paper mainly introduces the operation of diagnostic service function in the DoIP module of TSMaster, as well as the corresponding transport layer configuration, and unfolds the operation in conjunction with the common use of diagnostic function.

Keywords in this article: DoIP, in-vehicle Ethernet diagnostics, basic diagnostics, automated diagnostic process, Ethernet

Table of Contents for this article

1. TSMaster DoIP's TOSUN Ethernet hardware preparation

The realization of DoIP software function of TSMaster is based on the Ethernet hardware of TOSUN. Among the TOSUN Ethernet hardware applied to DoIP are TE1051, TE1054 (under planning) and TE1021.

❖ TE1051

TE1051 is an Ethernet to USB interface device all the way, which can transfer the data of standard Ethernet 100Base-Tx 1000Base-T or vehicle Ethernet 100/1000Base-T1 to PC via USB interface, and realize the simulation, analysis and testing of Ethernet data through TSMaster software, and also realize DoIP and SOMEIP and other functions. Meanwhile, the TE1051 is a compact and ruggedized device that requires no external power supply and is suitable for DoIP diagnostic brushing under various environmental conditions.
Figure 1-1 TE1051 Hardware

❖ TE1021

The TE1021 is an Ethernet to Ethernet converter (100/1000Base-T1 to 100Base-Tx/1000Base-T) that converts 100Base-Tx to 100Base-Tx or 1000Base-T1 to 1000Base-T. It is suitable for DoIP applications with different Ethernet interfaces. It can be used to convert 100Base-T1 to 100Base-Tx or 1000Base-T1 to 1000Base-T. It is suitable for DoIP applications with different Ethernet interfaces, and the TE1021 is compact and ruggedized for easy portability.
Figure 1-2 TE1021 Hardware

2、How to start using TSMaster DoIP module

The process of creating and basically using the DoIP module of TSMaster is as follows:

▲ Step1: DoIP is located in the main menu [Application] -> [DoIP], as in Figure 2-1.

Figure 2-1 DOIP
▲ Step2: [Add DoIP] module, you can add multiple DoIP modules, as in Figure 2-2.
Figure 2-2 Adding a DoIP Module

▲ Step3: Set the on-board Ethernet transport layer parameters according to the configuration of the ECU, such as diagnostic instrument type, channel, IP address of the device under test, and other Ethernet parameters and security access algorithms. The specific operation process is expanded in section 3 below.

▲ Step4: When configure the transport layer related parameters and security algorithm, start the project, click [Connect DUT] to connect the vehicle controller. When the connection is successful, the Basic Diagnostics window and the System Message window will prompt: Connect Ethernet DUT successfully, as in Figure 2-3. as well as in the place of ISO15765-2 you can see the service message of the connection, as in Figure 2-4.

Figure 2-3 Connecting an Ethernet DUT
Figure 2-4 ISO5765-2 Message
▲ Step5: After the service as well as the process are configured, directly open the start button at [Auto Diagnostic Process] to execute the diagnostic process. As shown in Figure 2-5.
Figure 2-5 Performing an automatic diagnostic process

3、TSMaster diagnostic instrument IP network interface configuration

The network interface configuration process for TSMaster is as follows:

▲ Step1:Find the main menu [Hardware] -> [TCP/IP Stack], as in Figure 3-1.

Figure 3-1 TCP/IP Stack
▲Step2: [Eth CH1] Right click and select [Add Network Card], as in Figure 3-2.
Figure 3-2 Adding Network Interfaces
▲ Step3:Select [User-defined Mac] in [General Setting] and enter the customized Mac address. As in Figure 3-3.
Figure 3-3 Customizing Mac Addresses
▲ Step4: [Enable IPV4], then open the [Add] button and enter the IP address and IP mask of the diagnostic tester, as in Figure 3-4.
Figure 3-4 Adding an IP Address

4. TSMaster DoIP Diagnostics Transport Layer Configuration

TSMaster provides DoIP's diagnostic transport layer configuration function, which allows users to configure the appropriate transport layer configuration such as diagnostic instrument type, channel, IP address, port and request and answer ID, and security algorithm according to their needs.

❖ 4.1 Diagnosing the Transport Layer

The configuration of the diagnostic transport layer is divided into two types depending on the type of diagnostic instrument:TE Series Devices and Systems TCP/IP.


4.1.1 TE series equipment
TE series device types take TE1051 as an example, TE1051 is a 1-way Ethernet to USB interface tool, which transfers to PC via USB interface and realizes DoIP function of Ethernet data through TSMaster software.

For the DoIP Diagnostics Transport Layer ISO TP, the Ethernet parameters and Diagnostics ID parameters for the DUT and tester are included, as shown in Figure 4-1.

Figure 4-1 DoIP Diagnostics Transport Layer ISO TP Configuration

The specific parameters of the DoIP Diagnostics Transport Layer ISO TP are described in the following categories:

▲ Bus type: diagnoses the transport layer type.
Use TOSUN DoIP function to select the bus type as [Ethernet], as shown in Figure 4-2.

Figure 4-2 DoIP Diagnostic Bus Types

▲ Diagnostic Instrument Type: Type of diagnostic equipment.

Connect the PC via USB, the type of diagnostic instrument selected is [TE series device], if it is a traditional network cable connection to the PC then select the system TCP/IP, as shown in Figure 4-3.

Figure 4-3 Ethernet Diagnostics Type Selection

▲ Channel: Logical channel used by the diagnostic module.

TSMaster supports multiple diagnostic modules to work online at the same time. Here is used to select the application logic channel of the current diagnostic module, which is selected through the drop-down list, as shown in Figure 4-4.

Figure 4-4 Ethernet Channel Selection

▲ IP Address Mask: IP address mask used for Ethernet communication.

▲ DUT IP: IP address of the DUT.
In DoIP communication, the IP address mask and the IP address of the device under test need to be set according to the specific network topology and communication requirements.

▲ DUT port: DUT port number.
In the ISO 13400 standard port 13400 is designated as the default port number for DoIP communications.

▲ Tester IP: IP address of the tester.
The tester IP is the IP address of the test device (e.g., TOSUN's TE051) connected to the PC. According to the IP address mask and the IP address of the device under test, configure the IP address of the PC and the IP address of the device under test in the same network segment, so that they can connect and communicate normally. The configuration of the IP address of the tester has been described in detail in the previous Chapter 3.

▲ Tester port: port for tester or PC
Note: There are no fixed rules for the port number setting of the diagnostic tool, users can set their own port number or use the port number automatically assigned by the software according to their needs.

▲ Request ID / Answer ID / Function ID: Sets the ID of the diagnostic request/answer/function frame of the PC tool side of the diagnostic module.


4.1.2 System TCP/IP
The system TCP/IP type is taken as an example, the TE1021 is connected to the PC directly through the system's network port.

The DoIP diagnostic transport layer, ISO TP, contains the Ethernet parameters and diagnostic ID parameters for the DUT and tester, as shown in Figure 4-5.

Figure 4-5 DoIP Diagnostics Transport Layer ISO TP Configuration

The specific parameters of the DoIP Diagnostics Transport Layer ISO TP are described in the following categories:

▲ Bus type: diagnoses the transport layer type.
Use TOSUN DoIP function to select the bus type as [Ethernet], as shown in Figure 4-6.

Figure 4-6 DoIP Diagnostic Bus Types

▲ Diagnostic Instrument Type: Type of diagnostic equipment.
If the diagnostic instrument is connected to the PC through the network port of the PC system, the diagnostic instrument type selected is [System TCP/IP], as shown in Figure 4-7.

Figure 4-7 Ethernet Diagnostics Type Selection

▲ Channel: Logical channel used by the diagnostic module.
Used to select the application logical channel of the current diagnostic module, here the default is [System Ethernet Interface], as shown in Figure 4-8.

Figure 4-8 Ethernet Channel Selection

▲ IP Address Mask: IP address mask used for Ethernet communication.

▲ DUT IP: IP address of the DUT.
In DoIP communication, the IP address mask and the IP address of the device under test need to be set according to the specific network topology and communication requirements.

▲ DUT port: DUT port number.
In the ISO 13400 standard port 13400 is designated as the default port number for DoIP communications.

▲ Tester IP: The IP address of the network port of the PC's system.
Based on the IP address mask and the IP of the test piece, configure the IP address of the PC and the IP of the test piece in the same network segment, so that the two can connect and communicate normally. Find the [Settings] -> [Network and Internet] of the PC, find the Ethernet that the network port is connected to, select [Properties], and select the [Edit] button in [IP Assignment]. Select Manual, open IPv4, and fill in the IP address as well as the subnet mask. As shown in Figure 4-9.

Figure 4-9 Ethernet IP Address Setting for PCs

▲ Tester port: port for tester or PC
Note: There are no fixed rules for the port number setting of the diagnostic tool, users can set their own port number or use the port number automatically assigned by the software according to their needs.

▲ Request ID / Answer ID / Function ID: Sets the ID of the diagnostic request/answer/function frame of the PC tool side of the diagnostic module.

❖ 4.2 Diagnostic service layer

The Diagnostic Service Layer parameters contain mainly Route Activation, S3, P2 Time parameters, and Secure Access with SeedKey loaded. This is shown in Figure 4-10.
Figure 4-10 Diagnostic Service Layer Parameters

4.2.1 Routing activation

Automatically execute the route activation command after connecting to the DUT]: After checking the box, the software will automatically execute the route activation command when the tester or PC establishes a network connection with the DUT.

[TCP Initialization Activation Timeout]: this parameter describes the maximum timeout from when the TCP_Data connection has been established until it expires. If the command to activate the route is not executed within the set time range, the DoIP module will actively close the TCP_Data socket. The specification defines the time as 2000ms.

[Activation Type], there are 5 types:

  1. [Default]: Default Activation Mode, which is the most basic type of routing activation, is typically used to establish a standard DoIP communications session. In Default Activation Mode, basic authentication and parameter exchanges are performed between devices to establish a communication connection.
  2. [WWH-OBD]: Diagnostic communication activation required by the Global Tuning and On-Board Diagnostics (GOTD) system, in which additional authentication and security verification between devices may be required to ensure communication compliance and security.
  3. [ISO/SAE Reserved]: Routing activation mode reserved for future standards or specific applications.
  4. [Central Security]: Central Security routing activation mode, which involves the core management and authentication mechanisms for vehicle network security. This mode is typically used to ensure that only authorized and authenticated devices can communicate with the vehicle's network systems.
  5. [Additional OEM-Specific Use]: An additional routing activation pattern reserved for specific use by an Original Equipment Manufacturer (OEM). Different OEMs can define and use specific route activation patterns to meet their unique diagnostic, communication or security requirements based on their needs and vehicle network architecture.


4.2.2 P2 time parameters

P2 Timeout]: Indicates the minimum time interval for the ECU to reply after receiving a diagnostic request frame. For the diagnostic tool, this parameter can be used as a timeout judgment parameter for waiting for a reply after sending a request. For example, if the diagnostic tool sends a diagnostic message and does not receive a reply within the P2 timeout period, the request is considered to have failed, and the timeout period exits.

P2 extension time]: When the diagnostic tool sends out a diagnostic message, and the ECU under test is too late to respond within the P2 timeout period, it replies with a frame 7F XX 78 message to tell the diagnostic tool that it is too late to respond, and it needs to extend the waiting time before replying, and then after the ECU sends out a delayed waiting message, it switches the waiting time parameter to the P2 extension time. After the ECU sends a delayed wait message, it switches the wait time parameter to P2 extended time.

The above two parameters can be tapped on the [Details] button to view the graphical description, as shown in Figure 4-11.

Figure 4-11 P2 Time Parameter Setting

4.2.3 Diagnostics online


Diagnostics Online includes S3 Server Time and S3 Client Time parameters.
[S3 Server Time]: Indicates the timeout period after the ECU has been switched from the Default session to another session, and how long it will automatically switch back to the Default session.

[S3 Client Time]: indicates the time interval for sending TesterPresent frames as the diagnostic Tester side.

For the schematic diagrams of the above two parameters, you can tap the [Details] button to view the graphical description, as shown in Figure 4-12.

Figure 4-12 S3 Time Parameter Settings
[Diagnostics Online]: In the TSMaster Break module, you can choose to configure and enable the Diagnostics Online command, as shown in Figure 4-13.
Figure 4-13 Diagnostics Online Setup

When enabling [Diagnoser Online], a switch to activate [Diagnoser Online] appears above the diagnostic module. Setting the Diagnoser Online to [On] state, the message is sent according to the set S3 client time interval.

The send byte for Diagnostics Online is optional. Three types are supported:

  • [Default Diagnostics Online Service]: 0x3E 0x80 for the most commonly used.
  • [Select from Basic Configuration]: Select the configured 3E command from the basic diagnostic configuration.
  • [User-defined]: Bytes used for customization.


4.2.4 Seed Keys

TSMaster provides two methods for handling SeedKey seed keys. The first one is the commonly used DLL dynamic link library that loads the mainstream SeedKey; the second one provides a built-in SeedKey interpreter, which can directly write the SeedKey source code and can be saved to generate a DLL dynamic link library.

-4.2.4.1 Loading dynamic link libraries

TSMaster not only supports DLL files encapsulated in C/C++, Delphi and other languages, but also adds support for DLL libraries based on DotNet platforms such as C#, VB.Net and other languages, which is efficiently compatible with DLLs generated by different platforms for secure access, bringing engineers a more convenient experience.

Load the dynamic link library loading screen, as shown in Figure 4-14.

Figure 4-14 Loading Dynamic Link Library

The icons are in order from left to right:

[1] Load DLL

[2] Delete DLL

[3] Open the DLL checker, through the DLL checker, the user can judge whether the loaded DLL interface is correct or not, and whether the algorithm meets the design requirements. For example, after the user selects the Level of Seed, input the Seed value and click GenKey to judge. If the interface of the DLL is unified with the interface defined in the template, a message will be output: Generate Key Success, and then the user can further confirm whether the algorithm in the DLL meets the design requirements according to the comparison between the Key value and the target value. As in Figure 4-15.

Figure 4-15 SeedKey verifier

[4] You can open the file path where the Seed&Key interface project is located in the TSMaster installation directory.

In the TSMaster installation directory, there are template projects that encapsulate the Seed&Key algorithm. TSMaster supports SeedKey function interface by default as follows:

  • Function interface 1:

unsigned int GenerateKeyEx(
const unsigned char* ipSeedArray, /* Array for the seed [in] */
unsigned int iSeedArraySize, /* Length of the array for the seed [in] */
const unsigned int iSecurityLevel,/* Security level [in] */
const char* ipVariant, /* Name of the active variant [in] */
unsigned char* iopKeyArray, /* Array for the key [in, out] */
unsigned int iMaxKeyArraySize, /* Maximum length of the array for the key [in] */
unsigned int& oActualKeyArraySize); /* Length of the key [out] */


  • Function interface 2:

unsigned int GenerateKeyExOpt(
const unsigned char* ipSeedArray, /* Array for the seed [in] */
unsigned int iSeedArraySize, /* Length of the array for the seed [in] */
const unsigned int iSecurityLevel, /* Security level [in] */
const char* ipVariant, /* Name of the active variant [in] */
const char* iPara, /* */
unsigned char* iopKeyArray, /* Array for the key [in, out] */
unsigned int iMaxKeyArraySize, /* Maximum length of the array for the key [in] */
unsigned int& oActualKeyArraySize) /* Length of the key [out] */

  • Function Interface 3:

bool ASAP1A_CCP_ComputeKeyFromSeed(
const unsigned char* ipSeedArray, /* Array for the seed [in] */
unsigned short iSeedArraySize, /* Length of the array for the seed [in] */
unsigned char* iopKeyArray, /* Array for the key [in, out] */
unsigned short iMaxKeyArraySize, /* Maximum length of the array for the key [in] */
unsigned short* opSizeKey) /* Length of the key [out] */


How to be compatible with other function interfaces

In daily use, it often happens that the user has already developed a SeedKey DLL, but the interface of this DLL is not any of the three mentioned above, so it can't be directly loaded into the diagnostic module of TSMaster. In this case, the existing SeedKey algorithm library can be packaged in the form of secondary packaging to generate a DLL that can be directly loaded into the TSMaster diagnostic module.

With a practical example to explain how to be compatible with other interface functions of the DLL file, the schematic diagram of the secondary packaging process, such as Figure 4-16.

Figure 4-16 Secondary Packaging Flow

▲ Step 1: Check the current DLL with the name UserSeedKey.DLL. the API functions inside this function are:

  • The function void GetKeyFromSeed01(byte* ASeed, byte* AKey) is called when the Seed level is 1.
  • The function void GetKeyFromSeed03(byte* ASeed, byte* AKey) is called when the Seed level is 3.
  • The function void GetKeyFromSeed11(byte* ASeed, byte* AKey) is called when the Seed level is 11.

Then we know that the current DLL does not support the above three function interfaces and needs to be packaged twice.


▲ Step 2: Select the GenerateKeyEx template project provided in the TSMaster installation directory, and use the function interface of the above DLL in this project. The basic idea is:

  1. Use Loadlibrary to dynamically user existing DLLs.
  2. The GetProcAddress function is used to dynamically obtain the actual function pointer used to compute the Key, based on the Level parameter passed in.
  3. If the acquisition of the function pointer is successful, the function pointer is used to transfer the Seed value and calculate the corresponding Key value.GenerateKeyEx Project Secondary Wrapper Example, Figure 4-17.
Figure 4-17 GenerateKeyEx project secondary packaging example

▲ Step 3: After the development of the GenerateKeyEx project is finished, TSMaster will load the DLL where GenerateKeyEx is located, it is important to note that you need to copy the existing UserSeedKey.DLL to the root directory of TSMaster or the directory where GenerateKeyEx.DLL is located. If not copied over, GenerateKeyEx.DLL will fail to find the corresponding dependency DLL when executing and the unlocking will fail.

-4.2.4.2 Writing SeedKey code

The operation flow in TSMaster's built-in algorithm editor is schematically shown in Figure 4-18.

Figure 4-18 Built-in Algorithm Editor

[1] Selection of functions for the SeedKey algorithm.
[2] Open the algorithm checker, which can be used to check whether the algorithm results are correct.
[3] Open the window for writing code.
[4] can be used to export the written code as a DLL file.
[5] Select a desired SeedKey function interface, and support the extension of custom function interfaces.
[6] SeedKey source code editing workspace for decryption algorithm code input and editing.

It is worth noting that TSMaster currently provides the most commonly used algorithmic functions in the form of interfaces, if you use your own special function interface form, you can contact Shanghai TOSUN support, the corresponding interface can be added to the options.

In addition, all interface functions define a return value type of s32. This constraint is added primarily to increase the rigor of the function. Among other things, a return value of 0 indicates success, and a return value of any other value has a corresponding error code. Therefore, when editing the code, you need to add the return value in the last line, as shown in Figure 4-19, otherwise the system will consider the algorithm failed after executing the function, and will not execute it later.

Figure 4-19 Return value of function return

5. TSMaster Basic Diagnostic Configuration

The Basic Diagnostics module contains the Basic Diagnostics Service and the Combined Service. For commands that are executed independently during the diagnostic process, they are in the Basic Diagnostic Service; $34, $36, and $37, which are used for file downloads, are put into the Combined Service. As shown in Figure 5-1.
Figure 5-1 Basic Diagnostic Configuration

❖ 5.1 Add Remove Service Command

Mouse over the service command that needs to be added and removed, right-click to expand it, and select whether the service needs to be added and removed, as shown in Figure 5-2.
Figure 5-2 Service Commands for Adding and Deleting

❖ 5.2 Configuring basic diagnostic parameters

Taking diagnostic session control as an example, it mainly contains the configuration of the following parameters, as shown in Figure 5-3.
Figure 5-3 Configuring Basic Diagnostic Parameters

[1] Configure service name: Users can configure a service name that is easy to understand and manage.

[2] Functional identifier or not: Whether or not this diagnostic service uses a functional identifier to send a diagnostic request.

[3] Whether or not there is a reply: Users can configure whether or not to check the contents of the reply for this service.

[4] Select the sub-service type: For example, DiagnosticSessionType in Session Control contains the session type as shown above.

[5] Byte order of parameter list: Motorola and Intel byte order is supported.

[6] Parameter List: Diagnostic services can be sent to the ECU under test with parameters in addition to the diagnostic ID and sub-service type ID. the parameter list contains the parameter lists of the request and answer frames, and you can choose to add/delete various types of parameters. As shown in Figure 5-4.

Figure 5-4 Adding and Deleting Parameters
Among them, different ID parameters can be set according to different service instructions. For example, the diagnostic session type parameter in the diagnostic request session is a mandatory setting, while the parameter list is optional. After modifying the configuration, the top of the interface will real-time display sample messages of the actual diagnostic message, such as the request protocol packet is: [10 01 xx xx]: xx means that the parameter is variable, according to the user's actual fill in the data to determine; diagnostic instrument will be received by the answer protocol packet is [50 01 xx].
Figure 5-5 Request and Answer Parameter Settings

❖ 5.3 Diagnostic service parameters

The Diagnostics module parameters support seven data types. These include: UInt, Int, Single, Double, HexArray, Ascii, and SystemVar. as shown in Figure 5-6.
Figure 5-6 Diagnostic Module Parameter Types

[1] UInt: Unsigned integer, its data length must be less than 32bits, and is a multiple of 8, can be 8,16,24,32bits.

[2] Int: signed plastic, its data length must be less than 32bits, and a multiple of 8, can be 8,16,24,32bits.

【3】 Single: Single-precision floating-point number, data length is fixed 32bits. user directly input and output floating-point data.

【4】 Double: single precision floating point number, data length is fixed 64bits. user directly input and output floating point data.

【5】 Hex Array: Hexadecimal array, data length is a multiple of 8. The input data satisfies the 16 prohibition data type.

[6] ASCII: ASCII string, data length is a multiple of 8. Input data is an array of ASCII characters, converted to hexadecimal and sent.

【7】 SystemVar: system variable, the length of the data is a multiple of 8. TSMaster system variables can support various data types such as Uint, Int, Single, Double, UintArray, DoubleArray, HexArray, String, etc. The specific data type is determined by the definition of the system variable itself. The specific data type is determined by the definition of the system variable itself.

❖ 5.4 Configuring Portfolio Services

The Diagnostic Combo Service ($343637 download file) contains a total of General Configurations, Erase Flash Configurations, Request and Transfer Data Configurations, Transfer Exit Configurations, and Expanded and Auxiliary Configurations. Each configuration is described in detail below.

5.4.1 Generic configuration

General configuration support for loading download file format for hex/bin/s19/mot/srec/vdf and so on. You can modify the starting address and data length in bytes, adjust the checksum byte order and custom CRC checksum algorithm import and modification, and can download the contents of the file through the download file viewer. Such as Figure 5-7.

Figure 5-7 Generic Configuration

[1] Service name: Configure the name of the service.

[2] File name: load executable file, support hex\bin\s19\mot\srec\vdf...

[3] hex viewer: TSMaster has a built-in executable file viewer editor, TSHexViewer, which allows users to view the details of the loaded Hex file, as shown in Figure 5-8.

Figure 5-8 Viewing Loaded Download Files

[4] Address and length identifiers. Bytes that modify the starting address and data length.

[5] Checksum related configuration. Checksum and byte order support Intel and Motorola. In the process of program download, in order to ensure the integrity of the data, it is necessary to introduce Checksum algorithm to check the integrity and validity of the data. TSMaster diagnostic module of the conformity service, the introduction of mainstream CRC algorithm for checking. In the TSMaster diagnostic module, the mainstream CRC algorithm is introduced for checking in the compliance service. The selection box is shown in the figure below, and the customized CRC checking algorithm can be imported and modified at the same time.

Figure 5-9 Support for custom CRC algorithm import and modification
After loading the downloaded file and selecting the specified algorithm, the diagnostic module calculates the checksums for the executable file, including the checksums for each data block of the executable file and the checksums for the file as a whole, as shown in Figure 5-10.
Figure 5-10 File and Data Block Checksums
TSMaster's diagnostic module is able to directly parameterize system variables, and after calculating the checksum value of each data block and file, it will be further converted into system variables automatically, as shown in Figure 5-11.
Figure 5-11 Tests and system variables
The generated checks and system variables can be added to the service parameters by the type of system variables. Take the commonly used checking the validity of executable files as an example, configure the following $31 routine control service command, you can realize the checking of the validity of the file, as in Figure 5-12.
Figure 5-12 Tests and system variables added to service parameters

5.4.2 Erasing Flash Configuration

Erase Flash Configuration, you can configure no auto erase, erase Hex address range, and erase the corresponding block before downloading each data block. The Desired Response value is filled in with the actual ECU response for input. As in Figure 5-13.

Figure 5-13 Erase Flash Configuration

5.4.3 Request and Transfer Data Configuration

The data format of the Request Transmit Data command can be modified, for example, from 00 to AA. you can customize the length of the maximum transmit data block, the default is 0x202, and the actual transmit layer packet is 514 bytes. As in Figure 5-14.

Figure 5-14 Request and Transfer Data Configuration

5.4.4 Transmission Exit Configuration

Transmission Exit Configuration, you can set up the following configuration, as shown in Figure 5-15:

  • uncalibrated
  • Checksum at ECU side ($37 + block checksum)
  • User-defined
  • Checksum on PC ($37 + block checksum)

Checksum type selects no checksum or checksum per data block

Figure 5-15 Transmission Exit Configuration

5.4.5 Extensions

Extended configuration can add signature files, special CRC algorithms, and general configuration - checksum and related configuration in the custom CRC algorithm import compared to the more flexible here can support any format of the file, such as Figure 5-16.

Figure 5-16 Extended Configuration

5.4.6 Auxiliary

The auxiliary can split the downloaded file by the size of the consecutive addresses, for example, splitting the data block by 0x1000. As in Figure 5-17.

Figure 5-17 Download File Split Settings

6. Diagnostic console

The Diagnostic Console serves as a diagnostic command debugger that allows the user to select each individual service command, edit the send service message and receive service message, and perform test verification. It mainly contains four working areas, which are service command selection area, manual command input area, diagnostic command send/answer area and diagnostic information area, as shown in Figure 6-1.
Figure 6-1 Console Work Partition

❖ 6.1 Service command selection area

The Service Command Selection Area is a list of executable services generated based on the base configuration or loading the ODX/PDX diagnostic database. Users can double-click to execute the selected service or right-click to select to execute the service, as shown in Figure 6-2.
Figure 6-2 Service Command Selection Area

❖ 6.2 Manual command entry area

During the test, if you want to send any diagnostic command, you can enter any message you want to send in the manual command input area. After entering the diagnostic message, click the Execute button on the right to finish sending the diagnostic message. In order to increase the flexibility of the test, you can also select whether to use the physical address to send or the function ID to send the diagnostic request message through the selection box. As shown in Figure 6-3.
Figure 6-3 Manual Command Entry Area

❖ 6.3 Diagnostic Command Send/Answer Area

In this area, the user can edit the Send Data segment and the Expected Received Data segment to initiate execution to verify that the diagnostic response of the ECU under test meets the actual requirements and synchronizes the diagnostic system variables, as shown in Figure 6-4.
Figure 6-4 Diagnostic Command Send/Answer Area

❖ 6.4 Diagnostic information area

This area is divided into the Service Layer Information and ISO15765-2 Data Flow areas, where the Service Layer Information displays the current flow of operational steps in the Diagnostic Module with response information. As in Figure 6-5.
Figure 6-5 Service Layer Information
When the diagnostic service does not get a positive response or no response, reporting error messages and so on. Such as Figure 6-6.
Figure 6-6 Negative Response Prompt for Service Layer Information
ISO15765-2 data flow area for displaying detailed service layer message information from the diagnostic module. Combined with the diagnostic database configured earlier, the raw message data can also be parsed into physical signals and other presentations. Taking the 22 service as an example, you can view the parameter data after parsing at the diagnostic service layer, as in Figure 6-7.
Figure 6-7 ISO15765-2 Data Flow Area

7, TSMaster automatic diagnostic process and registration system variables

❖ 7.1 Diagnostic Process Creation and Management

TSMaster's automated diagnostic process is not only for a specific application, but for the whole project to manage the diagnostic process. Users can configure test diagnostic process groups according to the needs of the complete project, and each group can contain multiple different diagnostic processes, with specific diagnostic steps in one diagnostic process.

Right mouse click on the UDS Process Management column to expand the Process Use Case Management action menu, as shown in Figure 7-1.

Figure 7-1 Operation menu of process use case management

The operation menu contains the following operations from top to bottom:

[1] Switching UDS process: Switch to the current UDS process node. Double-click the node, you can also achieve the effect of switching to the process node. After switching to the node, the node icon and background color is blue, and the node process on the right expands to show the detailed diagnostic steps included in the UDS process, as shown in Figure 7-2.

Figure 7-2 Switching UDS Flow

[2] Start UDS process: Start the diagnostic process for this node. After clicking this option, the diagnostic module automatically executes the diagnostic steps from top to bottom according to the configuration on the right.

[3] Interrupt UDS process: Clicking on this node interrupts the diagnostic process step being executed.

[4] Add process group: Add a new diagnostic process group, such as Test Group1. For example, add Test Group 1. Diagnostic process use cases can be added under the diagnostic group, which itself does not contain diagnostic steps.

[5] Add a new test process: A new diagnostic process use case is added, and detailed diagnostic steps can be added under the diagnostic process use case.

[6] Programming name: Select a process group or process use case, right click and select Edit name to edit the name of the node.

[7] Registering system variables: Select a diagnostic process use case and register it as a system variable.

[8] Anti-registration of system variables: Check the diagnostic process use cases that have been registered as system variables and unregister the system variables.

[9] Delete Selected: Deletes the selected node.

[10] Delete All: Clear all nodes.

❖ 7.2 Configuring the Automated Diagnostic Process

TSMaster automated diagnostic process, you can quickly configure multiple groups of diagnostic processes and can set up a loop run and register system variables for external calls, etc., as described in the following.

7.2.1 Introduction to the Automatic Diagnostics Toolbar

The Diagnostic Process Configuration toolbar is shown in Figure 7-3.

Figure 7-3 Diagnostic Process Configuration Toolbar

The icons are in order from left to right:

[1] Add a new diagnostic process group.

[2] New diagnostic process use cases have been added.

[3] Delete the selected diagnostic process group/use case.

[4] Start the configured diagnostic process.

[5] Diagnostic process being run by the terminal.

[6] Lock/unlock the process configuration area. If this area is locked, it becomes uneditable in the diagnostic process area.

[7] All-or-nothing diagnostic process.

[8] The number of cycle runs to enable the setting.

[9] The actual number of runs is displayed.


7.2.2 Automated Diagnostic Process Configuration Steps

In the UDS test flow area, right-click Create to create a new UDS flow, double-click the flow to enter it and unlock the logician, and you can set the number of times this flow can run in a loop, the default is not to enable loop running. As in Figure 7-4.

Figure 7-4 Creating a New UDS Process
Then right-click in the logical area to add a step or delete a step and further parse the functions in the Admin column. As in Figure 7-5.
Figure 7-5 Diagnostic Step Adding and Management

[1] Select a diagnostic process node in the left management column.

[2] Add, delete, and edit diagnostic steps in the edit area on the right.

[3] After adding a step, select that step type.

[4] Edit the step name.

[5] Select the type of address for this step, physical or functional.

[6] Configure detailed diagnostic request packets.

[7] Configure detailed diagnostic answer packets.

[8] Configure the wait time between steps after the end of this step.

[9] Configure the error handling method for errors occurring in this step.


7.2.3 Types of diagnostic steps

In the test steps, in order to increase the flexibility of the diagnostic configuration, 4 types are designed for selection, mainly containing: ordinary steps, selecting the existing configuration, seed and key, and tester online. Through these 4 types, basically covers all the mainstream diagnostic process requirements in the market, and the characteristics of each type are described in detail below. As Figure 7-6.

Figure 7-6 Types of Diagnostic Steps
[1] Ordinary steps: Mainly used for some simple occasions where both the request data and the answer data are straightforward. Directly fill in the request data you want to send in the request service, and fill in the expected reply message in the reply service, for example, the service request data is [10 01], and the service reply data is [50 01 12 34]. As in Figure 7-7. if some services do not require a response. you can not set up to have a reply.
Figure 7-7 Ordinary Step Types
[2] Select existing configuration: This configuration is designed to allow users to select the diagnostic services that have already been configured in the basic diagnostic settings, and this method is the most recommended configuration method for TSMaster. Select existing configuration process, as shown in Figure 7-8.
Figure 7-8 Selecting an Existing Configuration
[3] Seeds and Keys: Seeds and Keys only require the selection of Seed Level and Key Level parameters, and the decrypted DLL is directly associated to the Seed and Key DLL loaded by the Transport Layer Parameter Configuration, as shown in Figure 7-9:
Figure 7-9 Seeds and Keys

In this regard, it is necessary to configure the parameter configuration of the transport layer first, both in the Diagnostic Console module and in the Automatic Diagnostic Process module.

[4] Tester Online: To support more flexible testing needs, the automation process step provides the option to turn the tester online on and off with a command, as well as configure the data for that command and the cycle interval:

▲ Whether to start (start)/stop (stop) the command, as in Figure 7-10:

Figure 7-10 Start/Stop Tester Online Command
▲ Configure the data for the commands for which the tester is online and the cycle interval. such as 7-10:
Figure 7-11 Commands to Configure the Tester Online

7.2.4 Step interval

The delay between steps of the Diagnostic Process Module and steps is settable in ms, as shown in Figure 7-12:

Figure 7-12 Commands to Configure the Tester Online

7.2.5 Properties

In the properties, you can set the response to an error and whether this instruction stops or continues to run, as shown in Figure 7-13:

Figure 7-13 Properties

In TSMaster's subsequent product planning, responses to errors are allowed to jump to a specified process (e.g., to an erasure process), further increasing the flexibility of the Autorun process module.

7.2.6 Enabling step/position adjustment

For the diagnostic process steps that have been configured, users check the diagnostic steps they want to perform according to the selection box on the left. As in Figure 7-14.

Adjustment of Execution Order: Whether it is a test case group, a test case or a specific step in a test case, when the user wants to adjust the execution order among them, he can directly drag and drop the corresponding test case to the corresponding position.

Figure 7-14 Diagnostic flow step enable

❖ 7.3 Endogenous system variables for diagnostic modules

After adding a new basic diagnostic module to TSMaster, the System Variable Manager automatically generates a system variable whose owner is the diagnostic module Diagnostic, and you can configure the corresponding parameters by modifying the system variable. As in Figure 7-15.
Figure 7-15 Diagnostic Module System Variables

7.3.1 Diagnostic service generic system variables

Diagnostic endogenous generic system variables are included:

  • ExportProject: Used to export a diagnostic project.
  • ImportProject: Used to import an existing diagnostic project.
  • Diagnostic Tester Online TesterIsPresent: whether to start the Diagnostic Tester Online command.
  • DLC: Maximum DLC value for FD frames, this parameter is only valid in FD mode.
  • Minimum frame interval for receiving consecutive frames STMin (R): user-defined STMin parameter for the receiver, in ms. if set to 0, it means that receiving at the shortest event interval is supported,.
  • Minimum frame interval for sending consecutive frames STMin (T): user-defined STMin parameter for the transmitter, in ms.
  • User Define STMin: whether to manually define the minimum frame interval of consecutive frames, in ms.
  • FiledByte: sends the diagnostic frame filled byte.
  • FunctionalIDType FunctionalIDType: type of transport layer functional ID, 0 is standard frame, 1 is extended frame.
  • FunctionalID (FunctionalID): the transport layer functional ID.
  • Answer ID Type ResIDType: type of Transport Layer Answer ID, 0 is a standard frame, 1 is an extended frame.
  • Answer ID (ResID): transport layer answer ID.
  • Request ID Type ReqIDType: type of transport layer request ID, 0 is standard frame, 1 is extended frame.
  • Request ID (ReqID): transport layer request ID.
  • BusType: Sets the bus type: 0 for CAN bus; 1 for CANFD bus; 2 for LIN bus; 3 for DOIP (Ethernet-based diagnostics).
  • Channel Chn: Set the channel parameters of the diagnostic module, for example, 0 represents channel 1,1 represents channel 2.
  • Automation Process Progress UDSProgress: real-time progress of the automated diagnostic process, this variable is used to get the running status of the automated diagnostic process.
  • Secure access to SeedAndKeyDLL: Set the absolute path to Seed&KeyDLL, be careful with escaped characters when using it.
  • P2 Extended Time P2Extended: Sets the P2 extended time.
  • P2 Extension Time P2TimeOut: Sets the P2 timeout time.
  • S3 Server Time S3ServerTime: Sets the S3 server time.
  • S3 server time S3ClientTime: Sets the S3 client time.


7.3.2 Diagnostic service-specific system variables

After adding a new service to the Composite Diagnostic Service of the Basic Diagnostic Configuration, the System Variable Manager will also generate the corresponding system variable: service_name_DataFile, which is the absolute path of the download file, and modification of this variable can control the loading and switching of the download file. As shown in Figure 7-16.

Figure 7-16 Download File Path System Variables

In addition, when the download file is loaded, the system variable controller generates the per-block checksum, and the total checksum, the first address and length of the download file according to the selected checksum algorithm. If the conforming diagnostic service has been added, the download file is loaded and the download file-related variables are associated with the basic diagnostic service, these associated variables will be changed at the same time as the download file is replaced with minimal Project modification to realize the flexible switching of files.

7.3.3 Registered system variables for automated diagnostic processes

Diagnostic services can be flexibly configured in the Diagnostic Console as needed. After these diagnostic services are configured, the user needs to double-click in the Diagnostic Console to start the diagnostic service.

If the user wishes to start the diagnostic process command in the Panel interface or in the program, proceed as follows:

[1] First, in the diagnostic Basic Diagnostic Config form, select the target service, and then right-click menu to register the diagnostic service as a system variable, as shown in Figure 7-17.

Figure 7-17 Diagnostic Services Registered as a System Variable
After registration is complete, the process has three extra small colored circles in its icon, indicating that it becomes a service that registers a system variable, and the unregistered process has blue circles, as shown in Figure 7-18:
Figure 7-18 Icon change for registering as a system variable
[2] After the registration is completed, in the System Variable Manager, you can see the generation of system variables _Start and _Result as in Figure 7-19.
Figure 7-19 Variables Registered as System Variables

Where the value of _Start is assigned:

  • 0 is the idle state.
  • 1 is in the status of being implemented.
  • 2 is implementation success.
  • 3 is a failure of implementation.

The numerical result of _Result is:

  • >0 means start diagnostic process
  • = 0 means interrupt stop diagnostic process
  • <0 is an illegal parameter.

[3] Add the button button control in the panel Panel, and associated with the generated system variable process name _Start, will set the button press event to 1, as in Figure 7-20.

Figure 7-20 Panel Button Control Associated System Variables
[4] Run the program, click the test button of Panel, assign the value 1 to the process name _Start, and the diagnostic module executes the corresponding diagnostic process to realize the automatic running of the diagnostic process.

8. Typical applications of DoIP diagnostics

This article designs a simple BootLoader flow to illustrate how to configure a Flash BootLoader flow based on the TSMaster DoIP module.

❖ 8.1 Configuring the Brush Write Routine

[1] First create the UDS process: note that switching the editor to unlocked state, otherwise you can not add new process steps. As in Figure 8-1.
Figure 8-1 Unlocking the Editor
[2] Switch the default session, switch the extended session, and then switch the OEM customized session. in the basic diagnostic configuration is first configured in advance, as in Figure 8-2. and then add it in the automatic diagnostic process using the selection of the existing configuration, as in Figure 8-3.
Figure 8-2 Basic Diagnostics Configuring Session Services
Figure 8-3 Switching Default Sessions, Extended Sessions, and Vehicle Manufacturer Customized Sessions
[3] Add the seed and key steps to unlock the ECU, as in Figure 8-4.
Figure 8-4 Seeds and Keys Step

[4] Based on reading the data at location ID: F080.
Mode 1: Use the normal step configuration form, as shown in Figure 8-5.

Figure 8-5 Ordinary Steps to Read DID F188 Part Number
Way 2: Configured in the basic diagnostic configuration, and then used in the process to select the existing configuration, as in Figure 8-6.
Figure 8-6 Selecting an Existing Configuration to Read DID F080
[5] Next, write the data 20 11 20 00 00 00 00 00 00 00 at IDF086, as in Figure 8-7.
Figure 8-7 Writing a String at IDF186
[6] Check the brush writing prerequisites, as in Figure 8-8.
Figure 8-8 Checking Brush Write Prerequisites
[7] Add FlashDriver/application file process. First add FlashDriver and application files in the basic diagnostic configuration, as in Figure 8-9.
Figure 8-9 Basic Diagnostics Configuration Adding a Brush Write File
Then select the appropriate pre-existing configuration in the auto-diagnostic process and select the created combined download service. As in Figure 8-10.
Figure 8-10 Selecting an Existing Combined Download Service
[8] Use routine control to erase Flash. configure the post-erase instruction through the diagnostic base settings, the system variables of the start address and data length, and add the request parameters by means of system variables, as in Figure 8-11.
Figure 8-11 Diagnostic Base Configuration Erase Command
Then add to the process by selecting an existing configuration. As in Figure 8-12.
Figure 8-12 Routine Control Erase Flash

❖ 8.2 DoIP Diagnostic Process Runs with One Click

After completing the configuration, the total configuration flow is shown in Figure 8-13.
Figure 8-13 Completing the Flash BootLoader Configuration Flow
After connecting the Ethernet DUT, the auto-diagnostic process is executed with one touch of a button, and when each step is positively responding, it will be displayed in green color, as in Figure 8-14.
Figure 8-14 One-click execution of the automatic diagnostic process
The complete DoIP BootLoader brushing and writing process can be viewed in the Ethernet telegram message, or you can use bus logging to record the process message into a blf file for saving.
Figure 8-15 Ethernet Diagnostic Process Message
Above all, based on the DoIP module of TSMaster, realizing the zero-code approach, it is very simple and fast to develop Ethernet-based DoIP diagnostic process applications.

发表回复