overviewPreface
1. Setting the display refresh rate

2. Close to the curve point selection function

3. Setting the display message format

4. Message filtering
In the Trace window, TSMaster includes three types of filtering: based on data channel; based on message ID; and based on signal value range.
1. Message channel-based
Users who use multiple CAN channel devices can choose to view only the messages of the channels they care about. The setting method is as follows:
Filter->Select Channels, the available channel types are shown below:
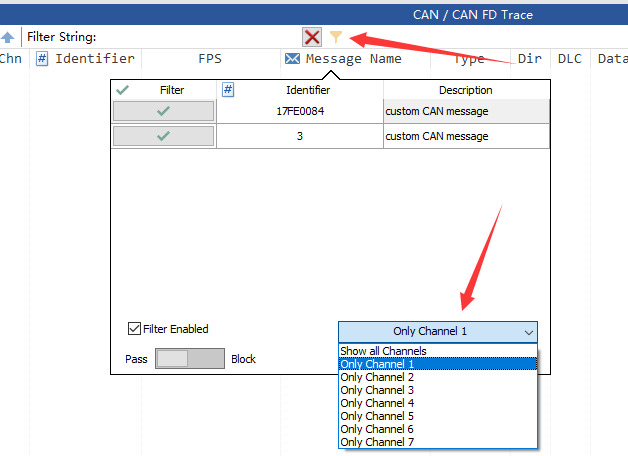
If OnlyChannel1 is selected, only data from channel 1 is displayed on the Trace window.
2. Message ID-based filtering
The configuration steps are as follows:
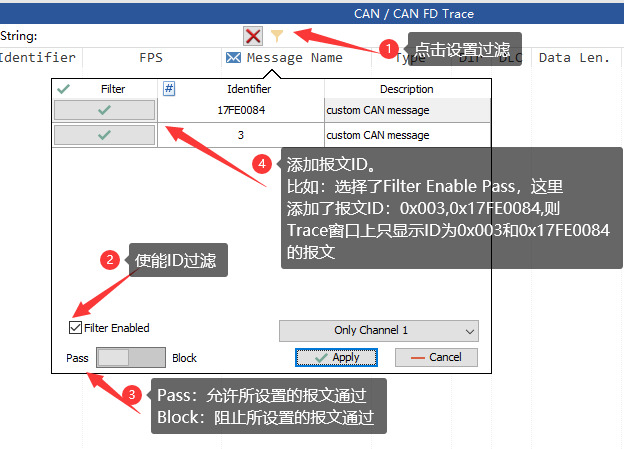
3. FilterString-based filtering
You can directly enter an ID value in the filter string, and the Trace window will leave only the messages corresponding to that ID; or enter a signal name, and the Trace window will leave only the messages associated with that signal. The details are as follows:
➢ FilterString Input ID value filtering:
The Raw Messages window is shown below, which contains multiple messages for ECU communication, as shown in the figure below:
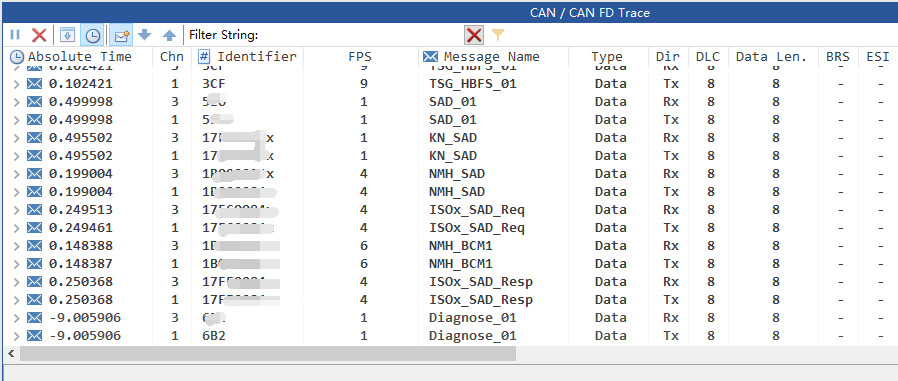

The FilterString window supports fuzzy queries. if you enter a value of 3 alone. only messages beginning with 3 remain in the Trace window.
Note: Here the message ID value is entered directly without any other additional description.
➢ FilterString Input signal name filter:
Based on the premise that the signal is loaded with a database, because there is a DBC database, there is the concept of signaling. This type of filtering makes it easy for R&D companies to look at the communication signals and messages they care about in more detail. The filtering is very simple, as shown below:

▲ Note:
- Each Trace window exists independently, and you can set corresponding filter conditions for different Trace windows. They do not affect each other.
- The bus system is working, the Trace window is not displayed or is displayed abnormally, it may be that the filtering conditions set previously are blocking the relevant display, please check the settings.
- Trace window filtering remains in effect while viewing log files.
5. Clearance of doubts
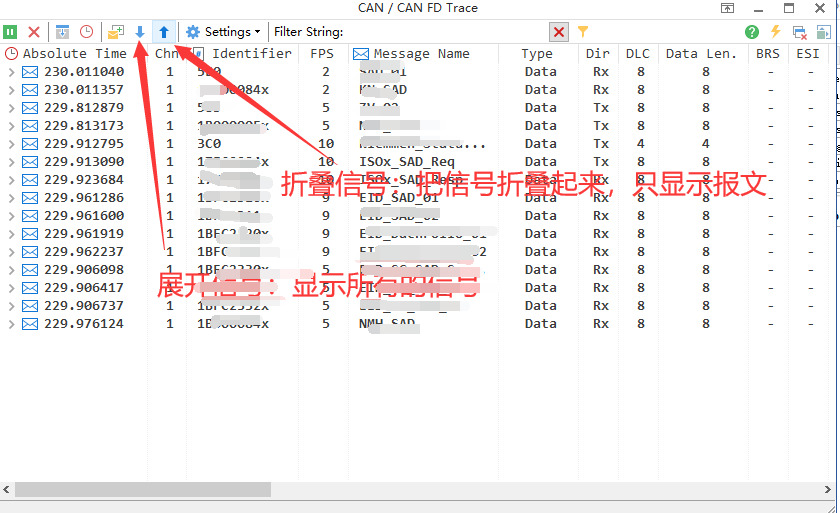
1. The message is fully expanded in accordance with the signal and is not easily observable, as shown below:
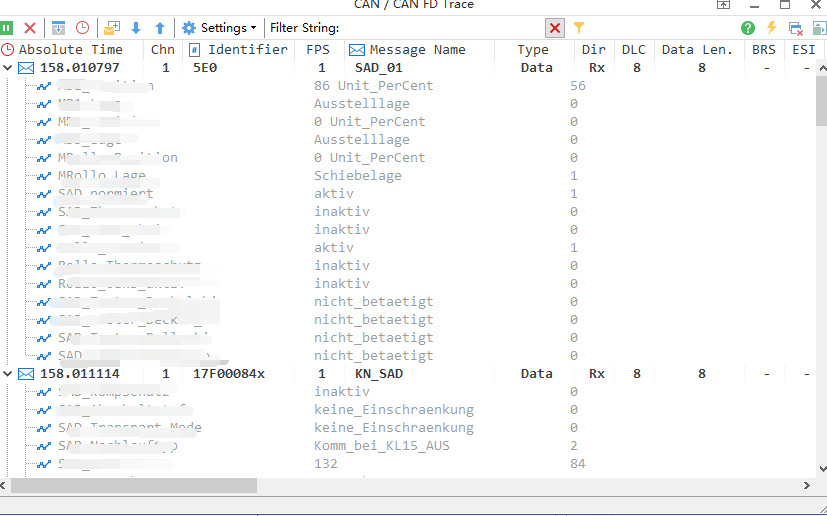
Solution:Expanding and collapsing the signal display is sufficient, as follows:
2. Why are messages monitored the moment the application is connected?
Problem Description:At the moment of clicking Connect Application, it always monitors the message in the Trace window, while it doesn't want to send the message itself.
The TSMaster program supports the association of the Start procedure with a function module. This is described in detail in the section Starting a Program. For example, if the Transmit form is checked, the messages above Transmit will be sent at the moment of startup; if the Bus Replay form is checked, the automatic bus messages will be sent at the moment of startup; and so on.
Solution:Contact the association between Start and the function module in the Tools->System Information form; or contact the association directly by clicking the button in the upper-right corner of the function module.


