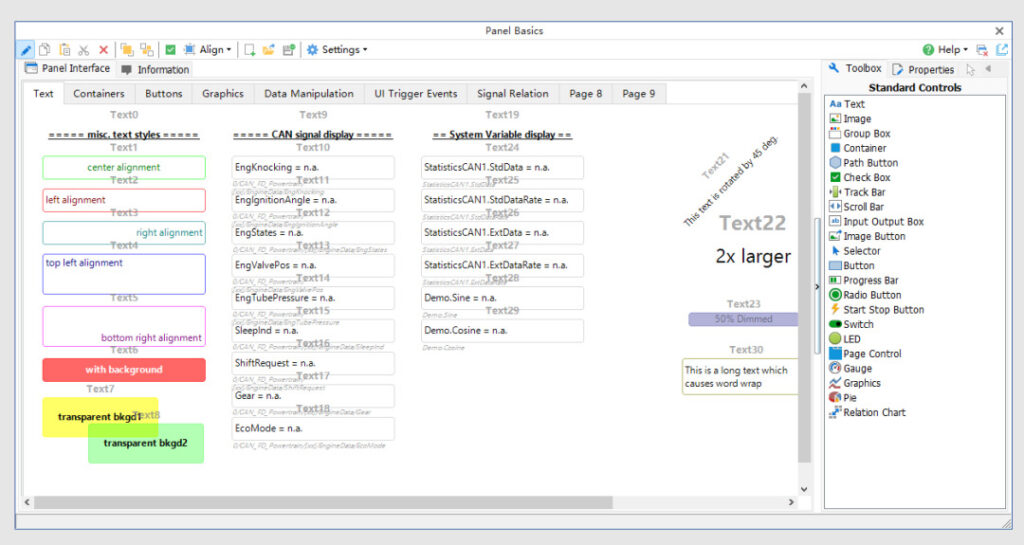
overviewPreface
1. Toolbar
1. Mode selection button, mainly contains the following modes:
(1) When you press state, the current Panel is in editing mode, users can add or delete controls and edit control properties.
(2) Pop-up state, the current Panel is in test run mode, the display is the actual running state of the panel, the user can not edit.
(3) Gray state, the current Panel is in running state. It means that the TSMaster is currently running with the device connected. If you want to re-edit the interface, you have to disconnect the TSMaster to enter the editing state.
2. Cascade control
Moving controls to the front and moving controls to the back when there is a control cascade.
3. Alignment controls
Control alignment is a two-step process:
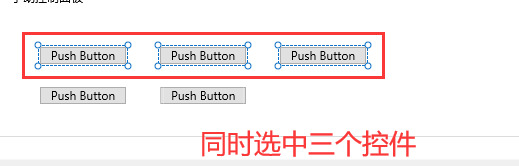
1) First select multiple controls that need to be aligned: hold down the Ctrl key and mouse click on multiple buttons, then select multiple controls. As shown below:
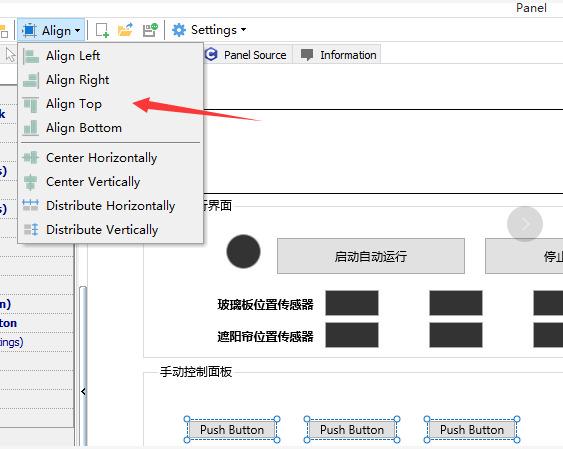
Alignment options are available:
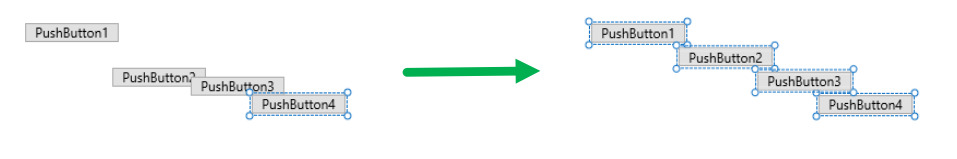
Align Left
Align Right
Align Top
➢ Align Buttom: Under Alignment
Center Horizontally: align horizontally with the center module.
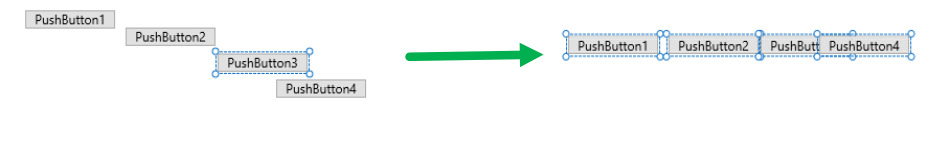

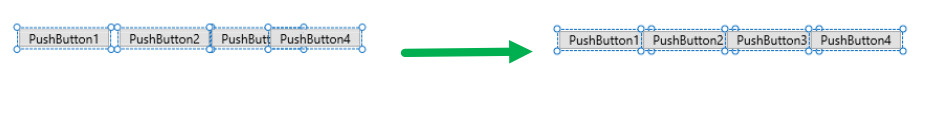
Taking the coordinates of the leftmost and rightmost one controls, the average of the spacing between controls is calculated and then evenly spaced in the horizontal direction.
4. New Panel
Creates a brand new Panel, which removes all existing controls from the Panel.
5. Loading configuration
Loads an existing Panel configuration file.
6. Storage configuration
Stores the current Panel configuration file.
7. Panel Parameter Configuration
It mainly contains the following parameter configurations:
➢ Feature Enable: whether to enable Panel
Layout: The overall layout of the controls inside the Panel.
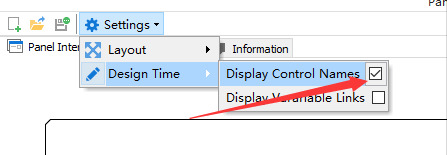
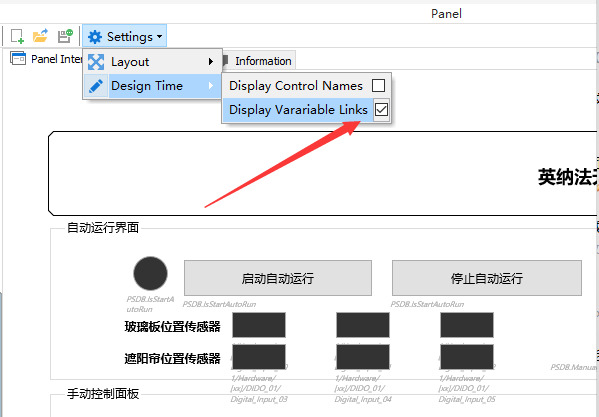
➢ Design Time: whether or not to show link labels and control names at design time
Refresh Rate: Configure the refresh time of the Panel data. The recommended refresh time is 300ms, if the computer configuration is higher, you can configure a higher refresh rate.
2. Basic control operation
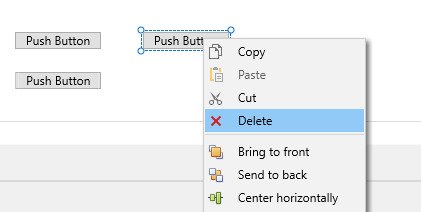
2. Delete controls
Directly Delete the key, or right-click and select Delete in the shortcut menu.
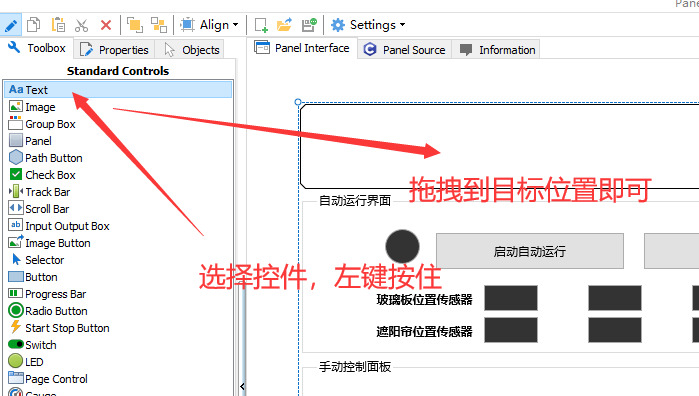
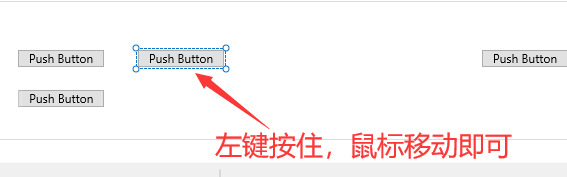
3. Mobile controlsControls will have their own container, in the container range, want to adjust the position, directly select the control, left click and hold, move can be. As shown below:
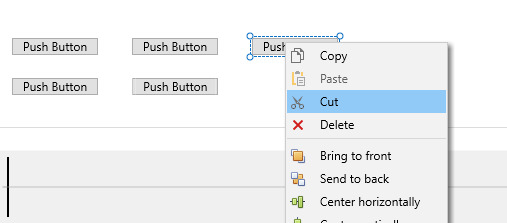
4. Moving outside the packaging
TSMaster does not support direct drag and drop outside the container, if you want to move the control out easily, you can use cut (Ctrl+X) + paste (Ctrl+V) can be used to move the control outside the container.
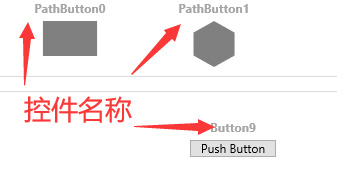
5. Display control type name
In the Design Time phase, the default is to display the name of the control (this name is the unique ID of the control, which is assigned by default, cannot be modified, and is not visible at runtime), as shown in the following figure:
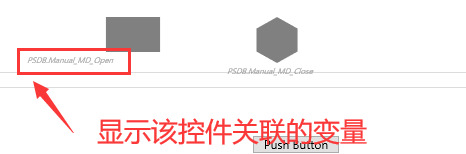
6. Show links to variables associated with controls
In the Design Time phase, the user can set up the display of the variables (CAN/LIN signals or system variables, etc.) associated with the current control, so that the designer has a clear idea of the current signal values associated with the control, as shown in the figure below:
3. UI events
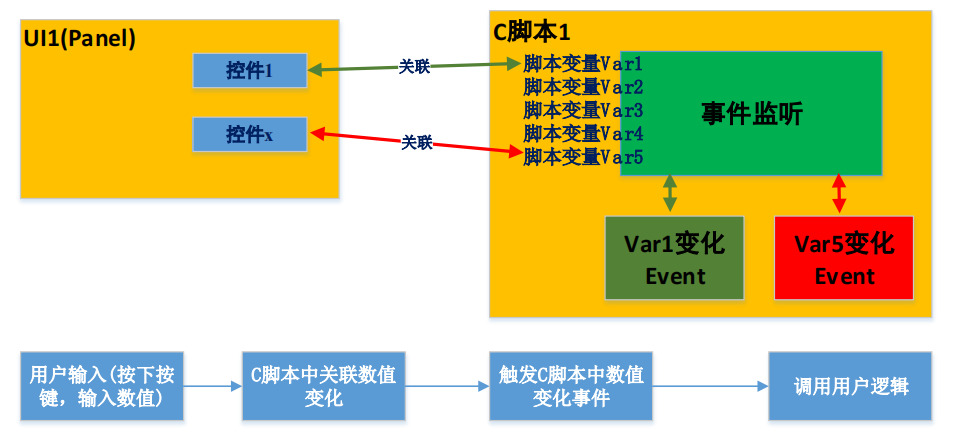
TSMaster provides a rich Panel interface. By associating variables, it is possible to modify the value of a variable, or present the modified value on the UI interface, which is easy to understand. If you want to realize that the TSMaster software sends a string of messages when a key is pressed, you need to work with C script to implement the UI event mechanism.
UI Event Mechanism
The event mechanism of Panel is shown in the following diagram:
4. Clearance of doubts
1. Why does the DBC parse correctly, but the control on the panel does not display correctly?
Problem Description:
Why does the signal value DBC parse out as 12%, but the dashboard always shows 1.0 (100%)
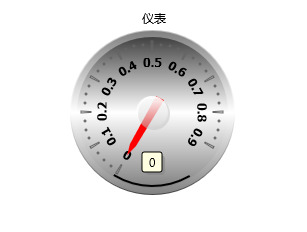
Check the signal definition, because the range of signal value definition is 0-100, the unit is "%", the parsed signal value is 12%, which means the signal value is 12, and then the unit is the string "%", not the signal value is 0.12. Therefore, the range of the dashboard should be 0-100, which is the same as the range in the signal definition. "Therefore, the range of the dashboard should be 0-100, which is the same as the range in the signal definition. If the range of the dashboard is set to 0-1, then when the signal value is 12%, the dashboard will of course display the maximum value of 1.
Solution:
Set the properties of the gauge control and adjust the display range of the control to be the same as the range of the signal. Adjust the range from 0-1 to 0-100, after adjusting, the meter display is normal.
2. Why can't I see any signals when I associate signals through Panel after adding DBC?
Problem Description:
Example database loaded: TOSUN_Hardware_Synthesize

As you can see, there are messages, signals, etc.
In the panel, add InputOutputBox and select associate a CAN signal, the result interface is as follows:
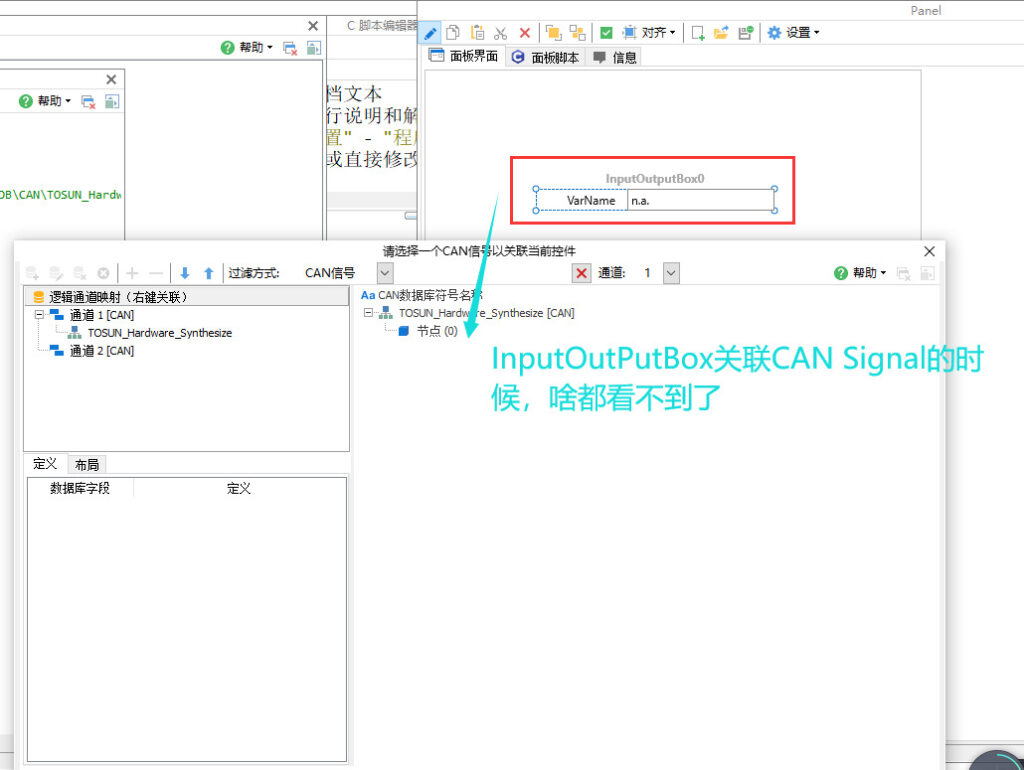
At this point, if you associate the signal with a single memory display control, such as Progressbar, you can see the signal.
Cause analysis:
The InputBox is the input signal that logically needs to be modified and sent to the bus, and therefore must be associated to the CAN signal of a transmitting node. Then we move on to this database:
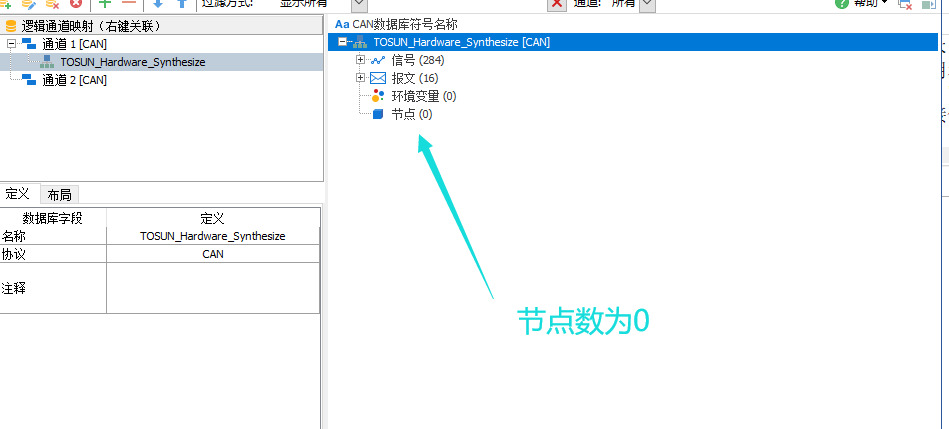
As can be seen, the number of nodes is 0, i.e. there are not any sending and receiving nodes. In this case it is not possible to start the RBS simulation because there are no generating nodes and no signals related to the transmitting nodes can be seen.
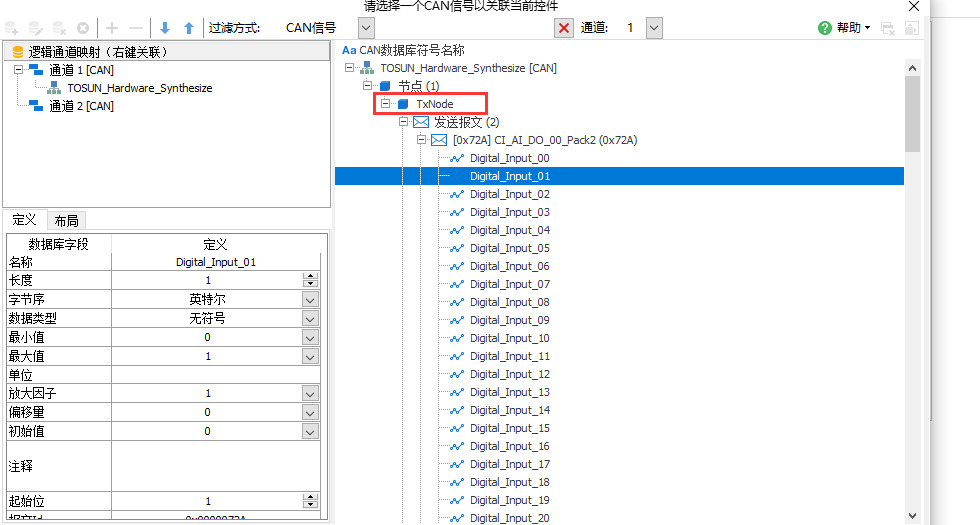
Solution:
Add the sender node and associate the message and signal to the sender node, and you can see the signal.
3. no scrollbars visible in Panel
When designing Panel, there is a situation where you can't see the form and you can't see the scrollbars (vertical+horizontal). If the form area is very large, beyond the screen display range, there will be a part of the form is obscured. This is shown below:
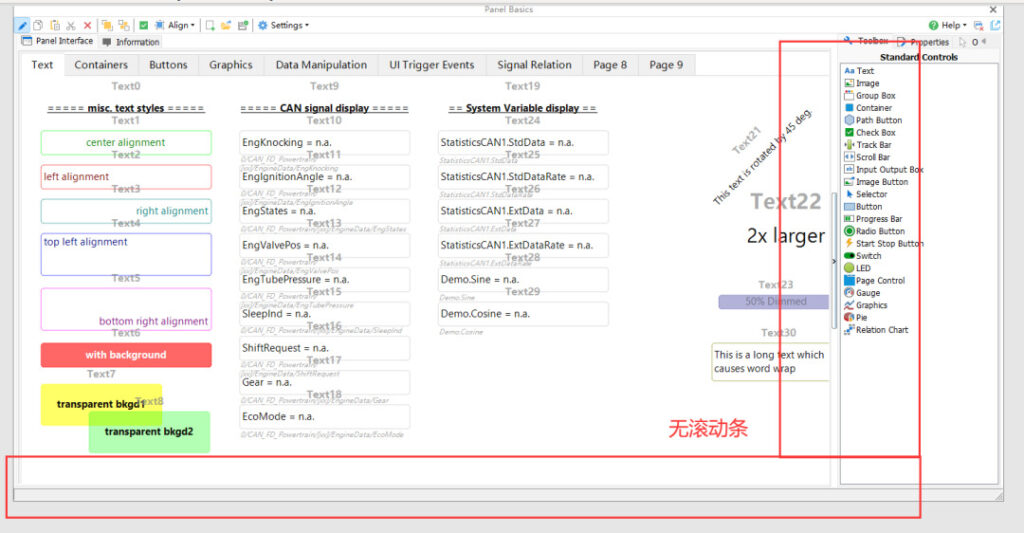
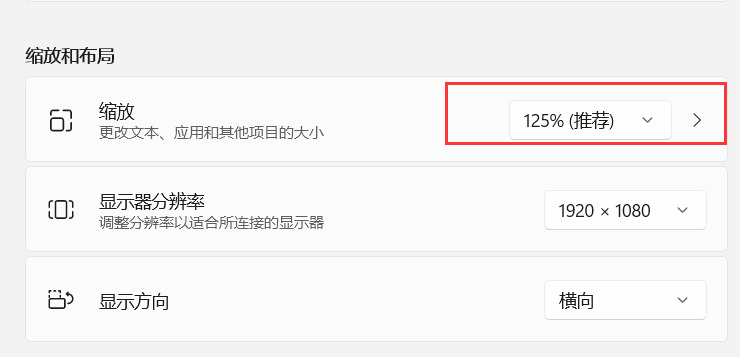
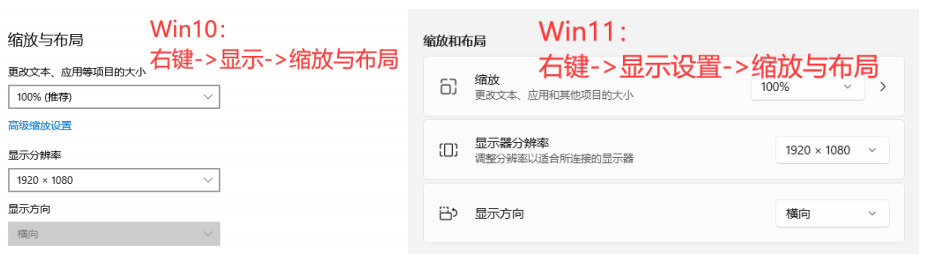
Cause analysis:
The computer screen is set to zoom in and out, causing the control to internally fail to correctly calculate the size relative to the screen, and therefore failing to display the scrollbars correctly. Check your computer settings as follows:
Solution:
Turn off screen zoom, set zoom to 100%, and restart the software to see the form's scrollbars again.
You can see that the scrollbars (vertical + horizontal) have reappeared on the form as shown below: