overviewPreface
A. Service command selection area
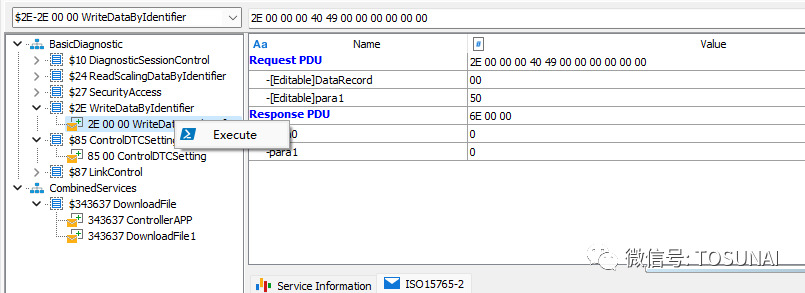
B. Manual command entry area
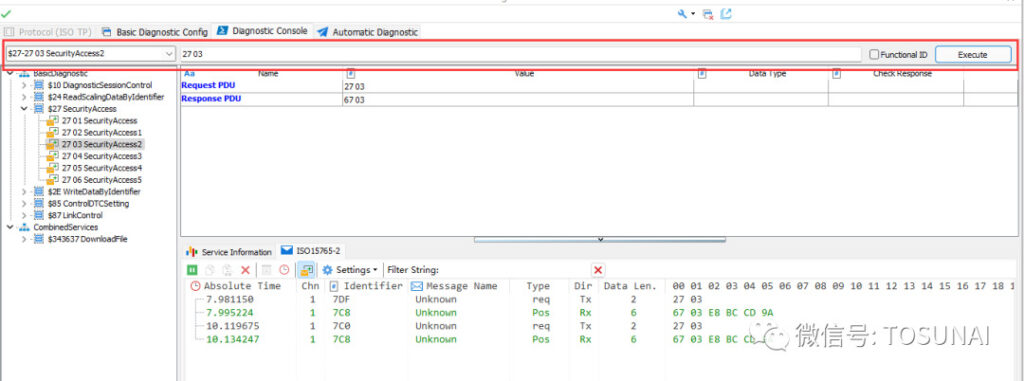
C. Diagnostic command send/answer area

❖ Enter diagnostic parameters:

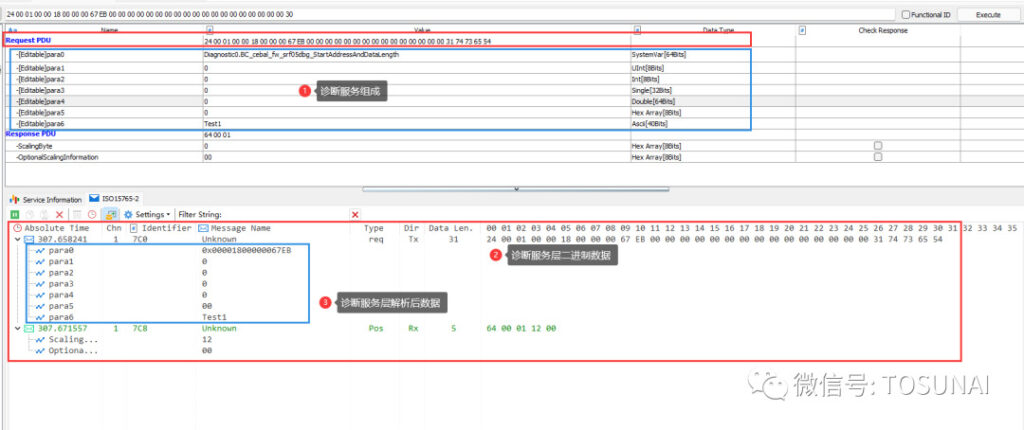
Request PDU::The diagnostic data packet bytes to be sent by the diagnostic module, this part of the value is not editable, the user in the parameter value after filling in, this part of the data automatically generate the corresponding diagnostic data value.
Diagnostic parameters:The correspondence is as follows:
[1] Para0, data type is UInt, data length is 8Bits, input 12, then the corresponding byte is 0x0C.
[2] Para1, data type is Int, data length is 8Bits, input is -1, then the corresponding byte is 0xFF.
【3】 Para2, data type is Single, data length is 32Bits, input is 3.1, then the corresponding bytes are 0x40, 0x46, 0x66, 0x66.
[4] Para3, data type is Double, data length is 64Bits, input is 3.2, then the corresponding bytes are 0x40, 0x09, 0x99, 0x99, 0x99, 0x99, 0x99, 0x99, 0x9A.
【5】 Para4, data type is Hex array, data length is 8Bits, input is 0x11, then the corresponding byte is 0x11.
[6] Para5, data type is ASCII string, data length is 24Bits, input string is "ASC", the corresponding bytes are 0x43, 0x53, 0x41.
Para6, the data type is a system variable. The data length is 64bits according to the value of the extracted system variable, and the name of the system variable is Diagnostic0.BC_cebal_fw_srf05dbg_StartAddressAndDataLength, and the system automatically extracts the actual value of the system variable according to this name and parses it into the sending message during execution.
After completing the input of the above diagnostic parameters, the generated diagnostic request packet is 0x24 0x00 0x01 0x0C 0xFF 0x40 0x46 0x66 0x66 0x40 0x09 0x99 0x99 0x99 0x99 0x99 0x9A 0x11 0x43 0x53 0x41 as shown in the figure above.
❖ Enter the answer parameter:

Among them, part 1 is exactly the same as the previous section on entering diagnostic parameters, and will not be explained here. However, an optional command is added to the answer parameter, whether or not to check this part of the parameter. If Check is checked, the response of ECU must be equal to the configured response parameter for this diagnostic test to be considered passed. If unchecked, the diagnostic module does not detect the content of this part of the byte in the ECU response.
[1] When all the above configuration responses are checked, the ECU response message must be equal to:
0x64 0x00 0x01 0x7B 0xFE 0x40 0x4C 0xCC 0xCD 0x40 0x1A 0x00 0x00 0x00 0x00 0x00 0x00 0x00 0x00 0x00 0x12 0x34 0x43 0x53 0x41 before it is recognized by the system as passing the diagnostic test.
[2] Remove the check mark to judge Para1 and Para2 as shown below:

At this time, the ECU must respond with a message equal to: 0x64 0x00 0x01 0x7B 0xXX 0xXX 0xXX 0xXX 0x40 0x1A 0x00 0x00 0x00 0x00 0x00 0x00 0x00 0x00 0x00 0x00 0x12 0x34 0x43 0x53 0x41, where the red part of the bytes of 0xXX indicates that the part of the bytes are not judged, and the other bytes must be equal to the above configuration bytes to be recognized by the system as passing the diagnostic test. The other bytes must be equal to the above configuration bytes to be recognized by the system as passing the diagnostic test.
[3] Remove the check to judge Para0-Pra5 as shown below:

D. Diagnostic runs
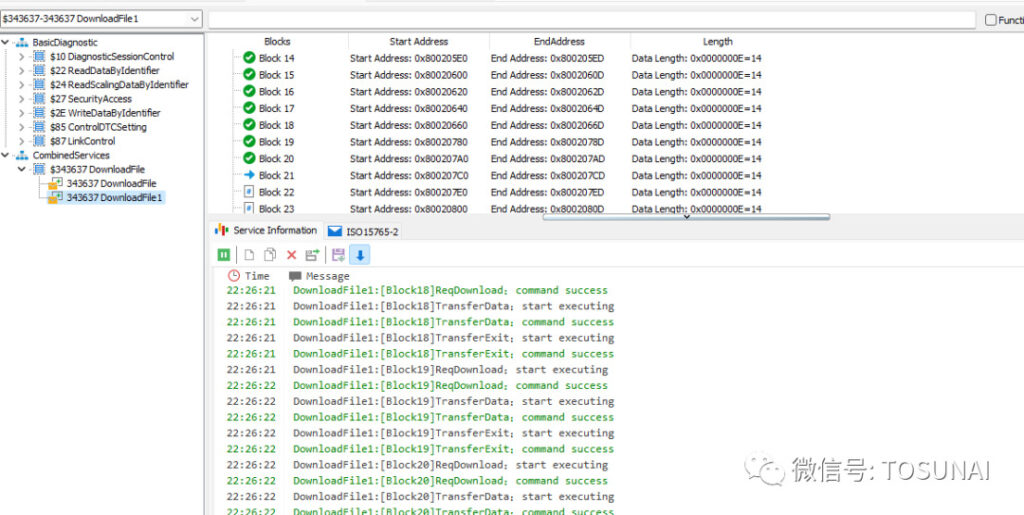
E. Diagnostic information/Trace area
❖ Service/Original Message Trace Comparison:
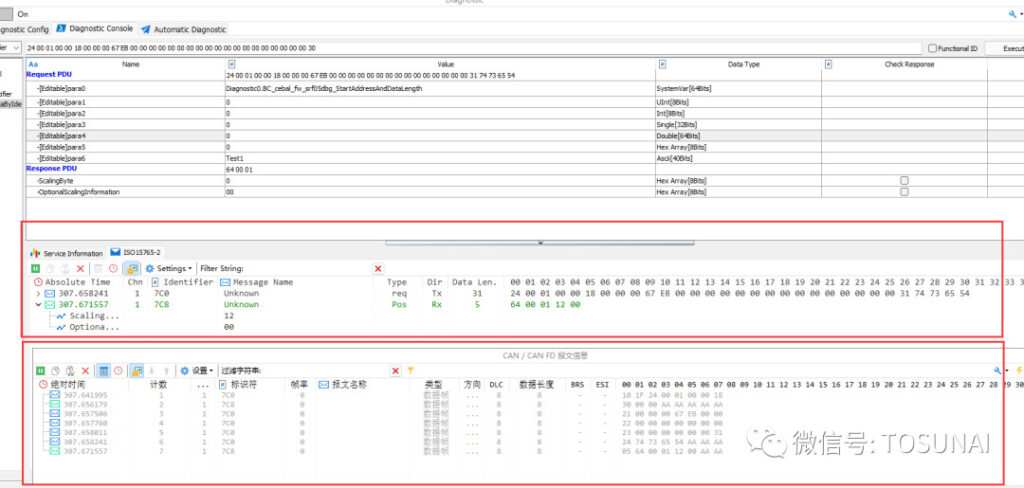
As you can see by the comparison above:
[1] The original CAN/CAN FD message area also shows transport layer information such as multi-frame, single-frame, and first-frame.
[2] Trace in the diagnostic module presents the user with direct service layer messages. For the use of, only need to care about the content of their own services can be sent, do not need to care about these contents of the specific how to split sent. Therefore, when doing diagnostic services, focus on observing the internal Trace interface of the diagnostic module.
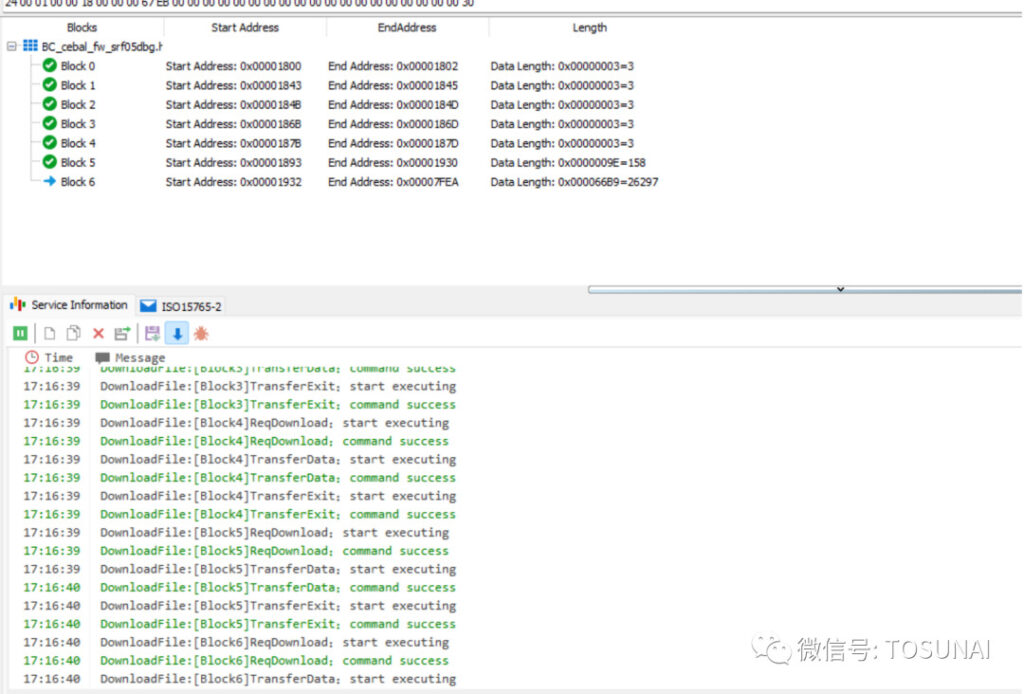
❖ Operation Tip Zone:

❖ ISO 15765-2 Service Message Area:
